   _       _
  (_) ___ | |_ ____
  | |/ _ \| __|_  /
  | | (_) | |_ / /
 _/ |\___/ \__/___|
|__/

Notes:
#
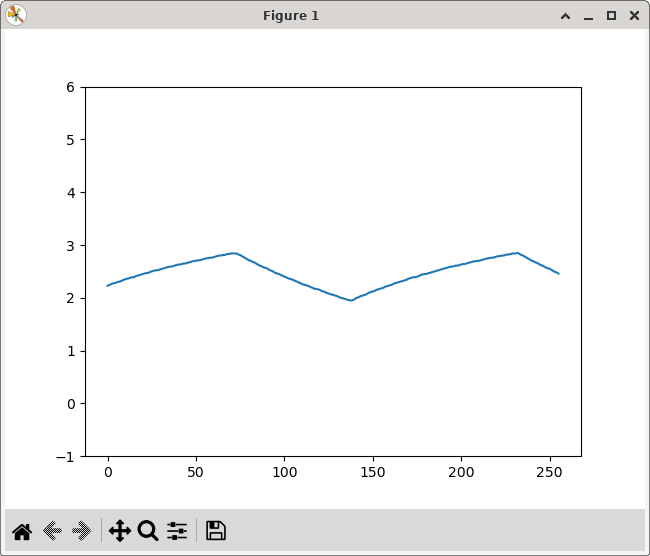
# Description: Real-time scrolling plot of sensor data using Arduino and Python (work in progress)
# Author: Ted Burke
# Date: 13-Dec-2023
#

import matplotlib.pyplot as plt
import numpy as np
import serial

# open serial port
ser = serial.Serial(port='/dev/ttyUSB0', baudrate=115200)

# create some dummy data to fill plot initially
x = np.arange(256)
y = 0.0 * x

plt.ioff()                  # don't need interactive plot
fig,ax = plt.subplots()     # create a figure, get axes object
ax.set_ylim([-1.0,6.0])     # set y axis limits
trace, = ax.plot(x, y)      # plot the dummy data on the axes
plt.show(block=False)       # display the plot

# Main loop receives incoming data and updates plot periodically
while True:
    if ser.in_waiting > 0:          # if there's data in the serial receive buffer...
        text = ser.readline()       # read a line of text from serial port
        text = text.decode('ascii') # convert from bytes object to string
        text = text.rstrip()        # strip trailing newline characters
        print(text)                 # print the text on screen
        y = np.roll(y,-1)           # rotate data in buffer to make room for next sample
        y[len(y)-1] = float(text)   # add the most recent data point to the buffer
    else:
        trace.set_ydata(y)          # update data in plot trace
        plt.show(block=False)       # redraw the plot
        fig.canvas.flush_events()   # ensure redraw actually happens now
void setup()
{
  Serial.begin(115200);
}

void loop()
{
  int V_du; // capacitor voltage in digital units
  float Vc; // capacitor voltage in volts

  V_du = analogRead(0); // measure capacitor voltage from A0

  Vc = 5.0 * V_du / 1023.0; // convert to volts

  Serial.println(Vc);

  delayMicroseconds(100000);
}